PhD Research
I'm about to finish my PhD at the Department of Computer Science of the University of Tübingen; supervised by Prof. Wolfgang Rosenstiel and Prof. Martin Bogdan.
In my PhD research, I developed methodologies to adaptively plan experiments of electrical systems, in order to make these experiments more efficient.
For example, a motor control system could fail for combinations of low supply voltage, high ambient temperature and certain load characteristics. To identify the failure characteristics (and lated design an improved system), one can perform a sequence of tests with different settings for the parameters. If one wants to keep the required number of tests at a minimum, it is intuitively better to often test close to the border between pass and fail region, because these tests yield more information. However, before running the tests, one doesn't know where the border will be.
My methodology guides new tests based on previous test results, in order to efficiently search for and explore the pass/fail border. The implementation has been proven to work well with dozens of parameters, and to be robust against noise and other disturbances that arise from testing real physical systems.
Highlights
- Some outcomes of my research have been filed for patent (filed 2013, still pending)
- I've been accepted as speaker at DATE 2015, one of the biggest conferences in my field
- The methods I developed actually get used in industrial R&D
The basic idea of my methodology is to use the test results from previous test runs to select which parameter configuration to choose for the next test. Under the hood, I'm combining different machine learning concepts like classification (e.g. with support vector machines), logistic regression and active learning. This makes it possible to convert the discrete list of known binary test results to a probabilistic prediction of failure likelihood. In turn, this likelihood estimation can be used to choose the parameters for the next test: Initially, there is little knowledge, and the algorithm explores the whole parameter space. As test results come in, an initial estimate of the border emerges, and the algorithm appropriately shifts its focus there. Further test results update this estimate, which again improves the knowledge about the border and further focuses the tests into that region. Therefore, the estimate quickly converges to the actual pass/fail border, which gets sampled with a high resolution.
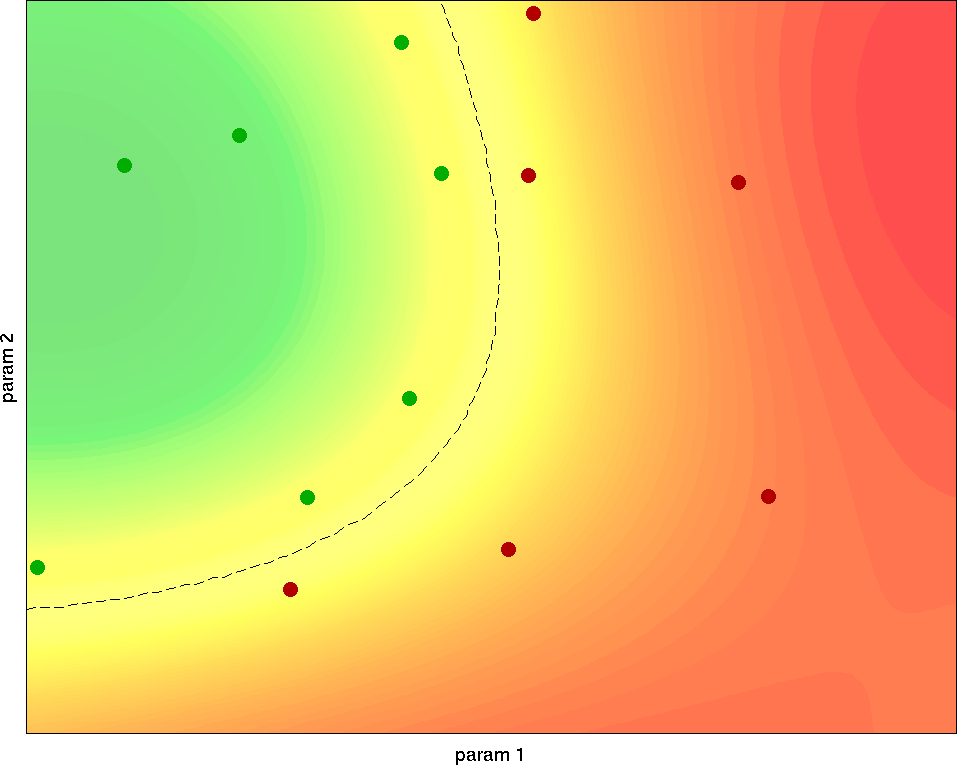
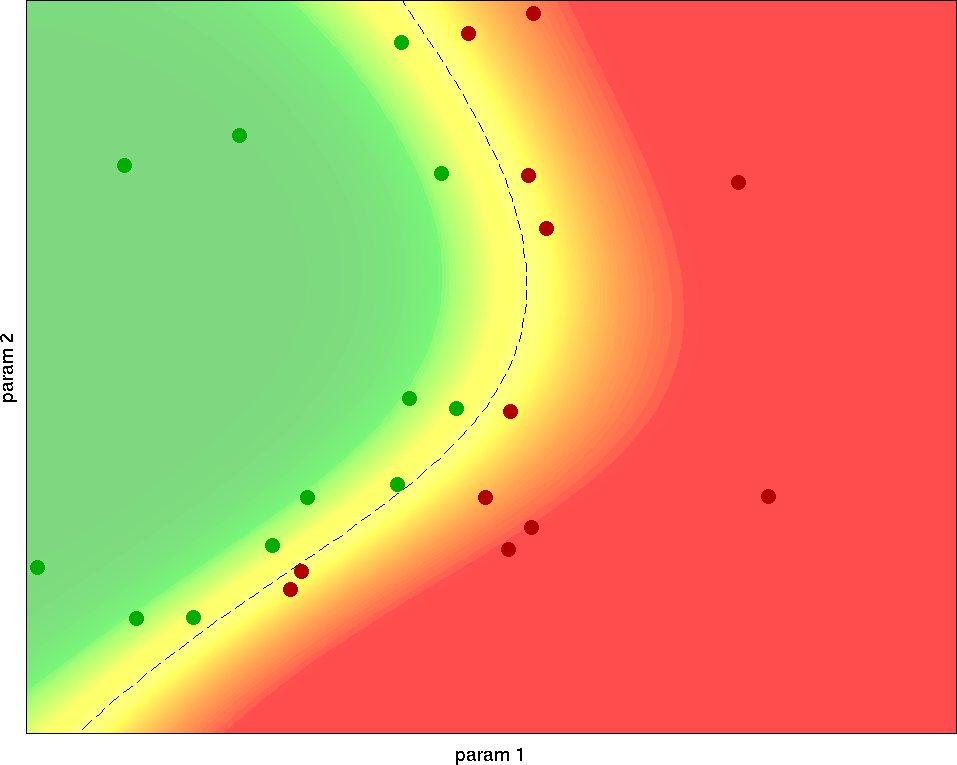
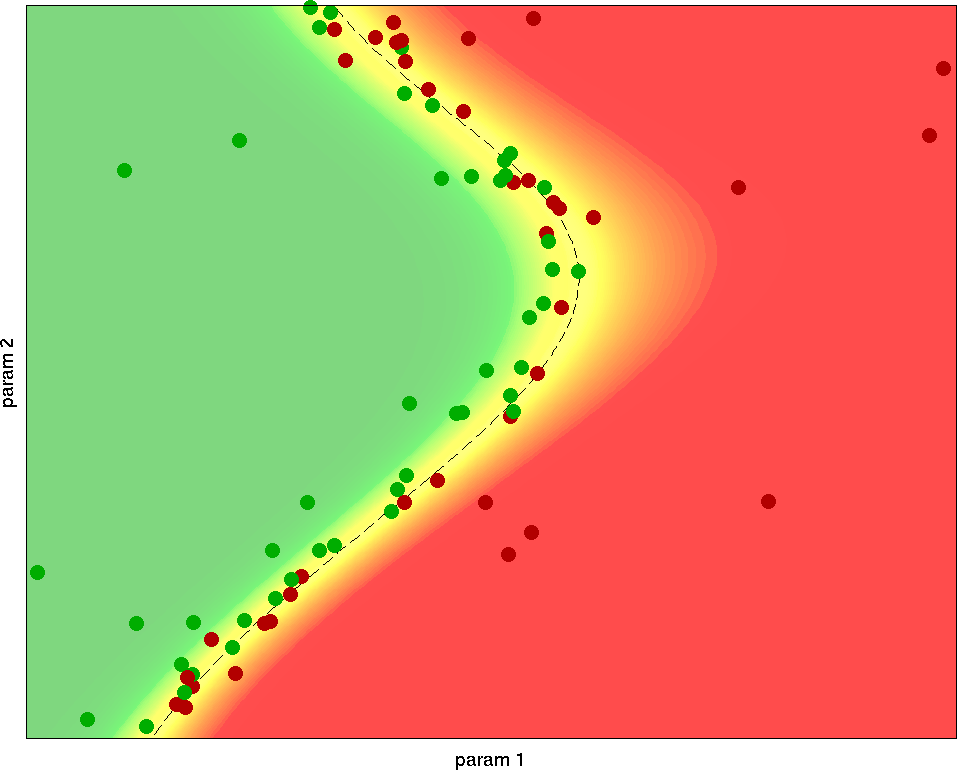
Working principle of my Bordersearch algorithm: The dots represent test results for different parameters x and y; the color gradient in the background shows the predicted failure probability based on the currently known test results. From the first samples, the algorithm gets a rough estimate of where the border might be. Further samples are focused around the border to quickly increase the local resolution. The remaining uncertainty in the last plot is mainly due to inherent testing noise in the border region: This random behaviour can't be predicted with 100% accuracy.
In real applications, there are many more parameters to consider. Although the complexity increases with the number of parameters, my methods can cope with dozens of parameters.
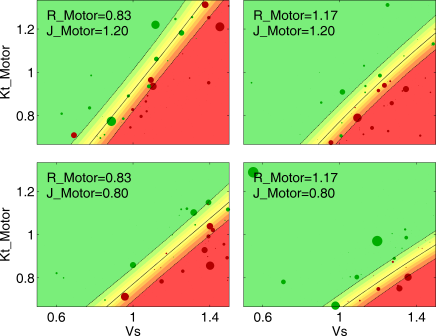
Another important aspect is the post-processing and presentation of the experiments: Engineers and managers have to act on the results, so the complicated, high-dimensional test data must be transformed to more comprehensible lists, charts and figures. By analyzing predictions of the machine learning classifier, it can be calculated how sensitive the system's performance is to changes of each parameter. This gives a ranking of how important each parameter actually is. On the one hand, this in itself is useful information in debugging; on the other hand, it allows to narrow further analysis and reporting down to the important parameters. Nevertheless, there often are three, four or more parameters that turn out to have an influence. I've designed multiple methods to visualize and explore parameter spaces with three or more parameters, often showing both actual test results and predicted failure probability.
My research was part of the BMBF-funded Rescar research project. I've been working in close cooperation with Infineon, a big German tier two automotive supplier. This allowed me to proof my methodology on real application scenarios; feedback from engineers helped me to develop solutions to actual problems.
Besides doing research, I've organized a seminar course for several semesters; was responsible for the exercises and exams for two intro to computational engineering courses with >150 students each; gave guest/substitute lectures to groups of 5 to 150 students; was part of the admin team of the department's Linux desktop and server setup, as well as the department's systems for version control, bug tracking, project management, collaboration and file storage; collaboratively designed and developed a GUI-frontend to guide engineers through experiment planning, execution interpretation and reporting; wrote Matlab, HTML and JS code to generate Pdf- and HTML-based reports with support for very big result tables; wrote a converter to generate C code from Matlab-based metamodels; learned much about bioinformatics and brain-computer-interfaces; participated in several trials; had lots of fun.